

This is the data of approximately 75 electric meters over a period of two months which is around 2-3 GB. Hence, we plan to analyze part of th e data (Approximately two weeks) to get interesting insights on the consumption patterns of different areas. The following questions were identified by the after many rounds of inspection and discussions:
1.Can we understand the consumption patterns like holidays vs weekdays?
2.Are analytics possible for parameters like power factor and excessive Consumption at each Circuit/Panel than their max rated power?
3.Can we detect the meter crossing EMD more than prescribed limit?
4.Break even analysis of energy consumption for each floor and/or meter?
5.Can we understand the Normalized Consumption pattern (KWH/Sqm) for each meter?
6.Can we benchmark Each office/block etc. against the standard green building practices?
7.Is comparison of average power consumption against peak consumption for each meter possible?
8.Can we find out which meter is consuming most units in a particular day?
Can we understand the consumption patterns like holidays vs weekdays?
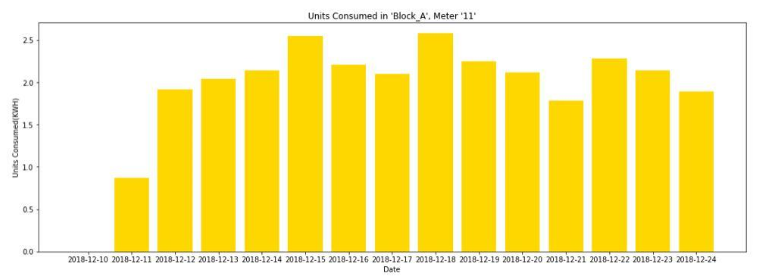
The following steps were followed to answer the business question: Loaded the dataset into pyspark working environment with the help of pyspark sql context with the variable name ems. We have assigned the column names for all the columns. We have registered a temporary table with the name ems.All the csv data is now imported into the ems table.We are interested in the variable cumulative_energy_kwh as it stores the data of the units consumed at each meter.Just like a conventional energy meter reading, the value in cumulative_energy_kwh also contains the last meter value. Hence, we need to consider the last value present in the table for a particular meter on a particular day.We have defined a function to fetch the units consumed at a particular meter in a block at a given day.There was no significant difference in the energy consumption during the weekdays.

Are analytics possible for parameters like power factor and excessive Consumption at each Circuit/Panel than their max rated power?
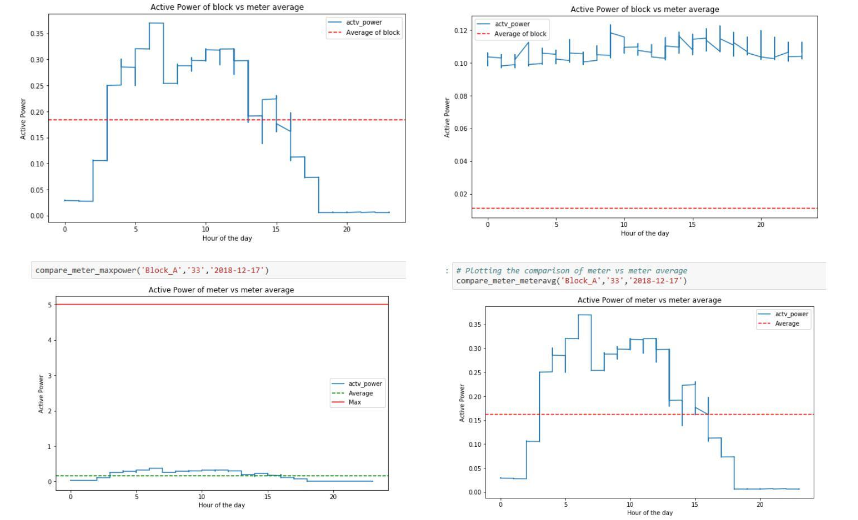
The following steps were followed to answer the above question: We are working with the temporary table ems and interested in the variables power factor and total_active_power.We have defined a function to collect and plot the instantaneous values of power factor for a given day in a particular block at a particular meter. We have also defined a function to compare the average active power of the whole block vs a particular meter. We have compared the average active power of block with that of the instantaneous meter values to understand the contribution of the meter to the average. The business relevance of this is that if unity power factor (“1”) is not maintained the efficiency of the power usage will be affected. Also, the power factor drops beyond a certain limit or when the active power consumption shoots up above a certain limit, the user will be fined by the electricity department. Hence it is very important to monitor power factor and active power. Findings The power factor for meter 33 is having steep fluctuations. Most of the time it is close to -1 which indicates that the type of loads is inductive. For meter 11 the power factor is close to +1. This indicates that the loads are capacitive in nature.

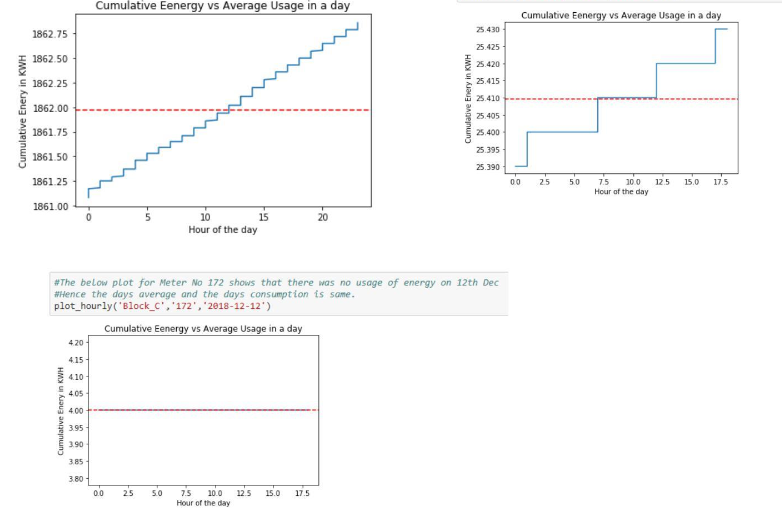
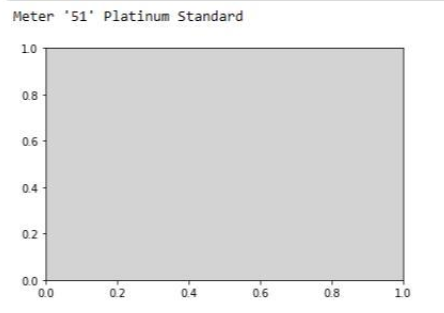
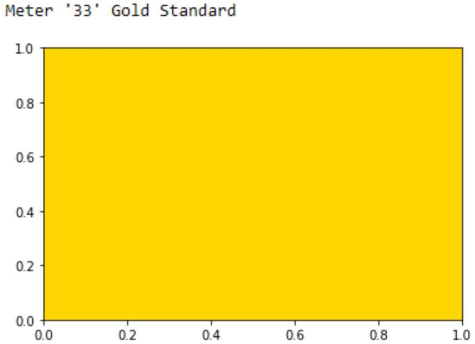
The office setup data was not available and hence we have made this classification meter-wise. The IGBC standards are a means for classifying building/premises as green based on the per sq. Meter energy consumption. The IGBC standards are: Platinum -Less than 10 KWH/Sq Meter/Month. Gold -10 to 15 KWH/Sq Meter/Month Silver -15 to 20 KWH/Sq Meter/Month. Green Certified -20 to 30 KWH/Sq Meter/Month. Non-Green -Higher than 30 KWH/Sq. Meter/Month. Weekly calculations can be approximately obtained by assuming 4.3weeks per month.We are using the temporary table ems.We have defined a collect the weekly consumption of one meter in a block. We are then plotting a color-code for the meter as per IGBC standard color-code designation. The business relevance of this analysis is that the buildings/premises need to maintain good IGBC standards to be classified as a “green” or energy efficient building in order to claim benefits like carbon credits and also to avoid fines in certain extreme cases.

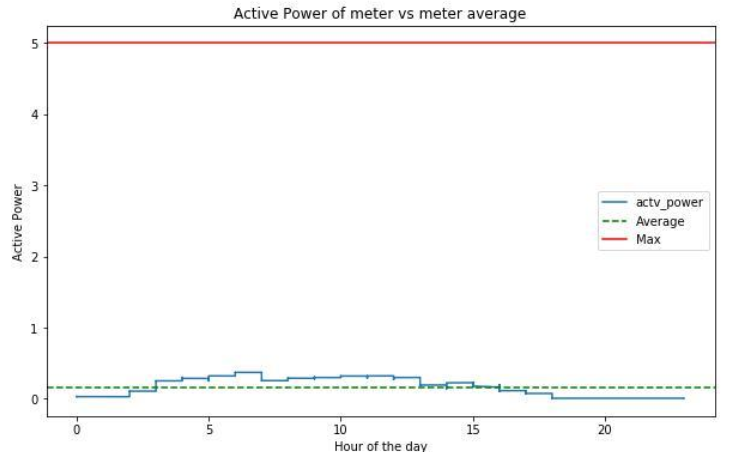
Is comparison of average power consumption against peak consumption for each meter possible?
We are using the temporary table ems.We have defined a function to find-out the maximum active power consumption of a meter in a block for a particular day. We have also defined a function to plot the instantaneous values of energy consumption at a meter in a block on a particular day. Finally, we are plotting the instantaneous values against the time of the day at which the values are recorded keeping the maximum value as a reference line. The business relevance of this analysis is that we will be able to understand the energy demand at the meter level with respect to time. We will be able to maintain the unity power factor in a better fashion.
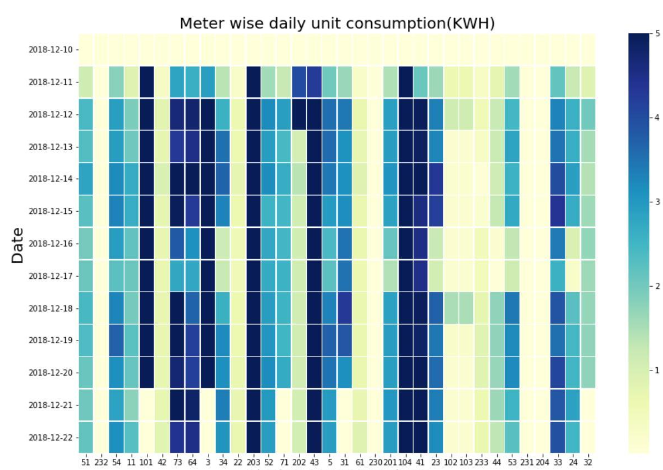
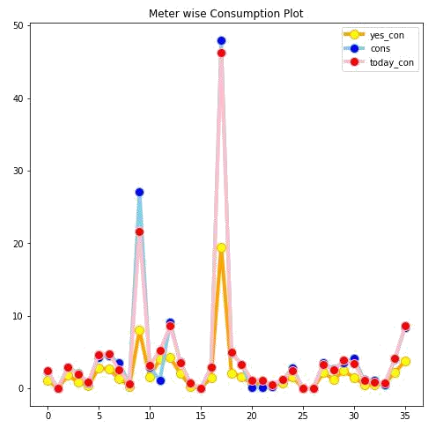
Can we find out which meter is consuming most units in a particular day?
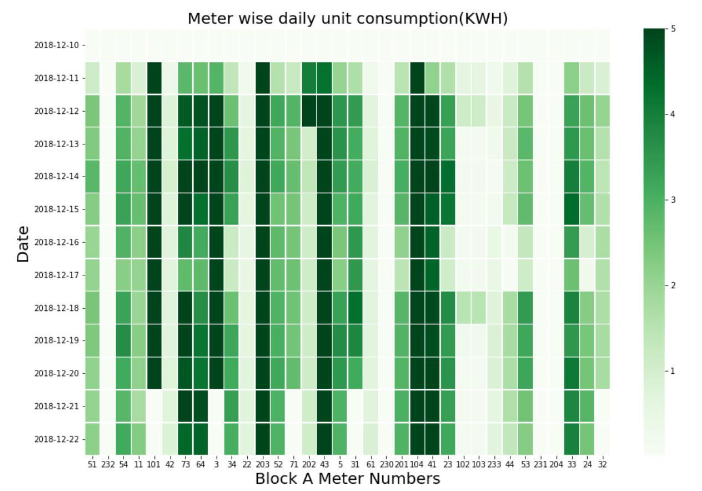
We are using the temporary table ems.We have defined a function to compute the energy consumption of each meter for a block for a range of dates. We have made a data frame with the units consumed. We are running a function to find out the maximum value from the data frame pertaining to a particular meter and date. The business relevance of this analysis is that we can pin-point the most lead-intensive meters and understand the load distribution at node level. Each node can be monitored for anomalous behavior.
+91 9030070085
+91 7801063999
#501C, Bankers Chambers,
A S Raju Nagar, Kukatpally,
Hyderabad Telangana -500 072.